
You have noticed the website you are visiting is slow. Or perhaps you switched hosting providers and want to test the latency difference. In these scenarios, it makes sense to perform a traceroute.
Traceroute is a command that lets you test how many hops you are connecting over and the latency between those hops. It’s useful because if you feel like there is an abnormal amount of latency when you are connecting to an online service, you can see exactly where that delay is happening and how long it’s taking. Along with “pinging” traceroute is one of the most commonly used commands to test network connection.
Performing a Traceroute
Steps to Perform a Traceroute:
- Open the Windows command prompt by typing “cmd” in Start.
- Type the command “tracert websiteurl/ip (websiteurl/ip being the website domain or ip)
Over the course of the next few seconds., you will see all the successful hops your request makes. If the request fails to make it to your destination, you can see where the connection failed. You will also be able to measure how much time it takes to connect across each hop.
How to Read a Traceroute
Reading a traceroute can be confusing because it doesn’t display total latency at the end and also shows multiple columns of latency readings. Here is how to read a traceroute.
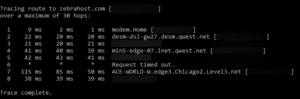
Left column: the left column displays the number of hops that your request connected over during its trip to the domain you requested. In this example, zebrahost.com traveled over 8 hops from my IP.
3 central columns: The 3 columns in the middle with time readings represent the amount of time in milliseconds it took to travel over each hop. The reason there are 3 columns is because the “tracert” command actually performed 3 separate tests by sending 3 requests to zebrahost.com. This is so that when performing a latency test like traceroute, consistency can also be tested. For example, you might have noticed that the first test showed 9ms to connect to the first hop vs 2ms and 1ms for the next couple of tests. That means that there was an abnormal amount of latency in that particular test. This could be for a variety of reasons. But you will notice that the other two tests showed closer results and the rest of the test across other hops were closer together.
Right column: The right column shows the IP/domain of each hop that you are crossing over. Because the internet is a web of networks and various services like firewalls and CDNs add extra stops, it is very common to be crossing over many IPs before reaching your destination.
Do You Have Bad Latency?
Traceroute is most useful for diagnosing if you are experiencing an abnormal amount of latency. Latency expectations differ according to the task at hand. For example, gaming will require less latency due to the need for quick reaction time. On the other hand, a website can experience more latency because there is no response required from the user once a URL is entered.
Internet provider Optimum claims that 100ms is within an acceptable range for gaming while the ideal is 40-60ms. This sentiment is also echoed across other providers and users themselves.
For websites, anything under around 300ms is considered acceptable to good. For example, in column 1 of our test, zebrahost.com experienced 288ms of latency placing it within 300ms for my location.
SaaS products will have a range as far as latency requirements go. For example, accessing a tool like Salesforce might require a similar amount of latency as any other website. But a collaborative tool like Office 365 might benefit being somewhere in between the recommendation for games and websites.
If you feel like your website or service is running slowly or your users have complained about slow loading times, it might be worth having them perform a traceroute. If there are performance issues you will see interruptions in the traceroute. But if it’s generally poor performance above expectations, it might be worth trying a few things.
How to Combat Low Latency:
- Use a CDN: CDNs have become a common solution for latency issues. CDNs allow data to be cached closer to users so they can access your services closer to them.
- Lazy Loading: This is not a real solution for latency but makes your website or app seem like it is loading faster to users. Assets are not loaded until they are needed. With fewer assets needing to load when a user first uses a site, it can load perceivably faster at one time.
- Choose to host closer to your users: By choosing a central location that’s close to most of your users, or within a network of servers distributed where your users are globally, is amongst the best strategies to reduce latency. For example, ZebraHost’s Kansas City data center provides low latency connections to users across the Midwestern United States. The central location of Kansas City also provides acceptable latency for users across the US.
Summary:
Traceroute is one of the most useful commands for diagnosing latency and network-related problems. Traceroute allows you to see all hops your request is passing through and how long each hop takes. If your request fails to make it through, you will see where the request failed and potentially the error received.
While latency cannot be completely eliminated, it can be improved by strategies such as CDNs, choosing the correct hosting location, and being smart about how much and how often assets are being delivered to the user.